How to Set up VS Code to use PHP with Xdebug 3 on Windows
Table of Contents
Xdebug 3 is an extremely powerful debugging tool for PHP. Although print_r(), var_dump() and dd() have their uses,
Xdebug gives more powerful debugging options: step debugging allows the ability to
view execution of each line of code, including the ability to view all variables and their
values. Code coverage is useful to identify untested code, or code which is
never executed (dead code). Development helpers improve the built-in var_dump()
function, providing stack traces etc. VS Code can also change the variable, which is useful when testing manually
particular functions while stepping through your code.
Xdebug’s step debugger allows you to interactively walk through your code to debug control flow and examine data structures
Code coverage tells you which lines of script (or set of scripts) have been executed during a request. With this information you can for example find out how good your unit tests are.
Xdebug’s development helpers allow you to get better error messages and obtain more information from PHP’s built-in functions. The helpers include an upgraded var_dump() function; location, stack, and argument information upon Notices, Warnings and Exceptions; and numerous functions and settings to tweak PHP’s behaviour.
This is how I set up VS Code to use PHP with Xdebug on Windows using Laragon.
Install Laragon for Windows #
Laragon is a portable, isolated, fast & powerful universal development environment for PHP, Node.js, Python, Java, Go, Ruby. It is fast, lightweight, easy-to-use and easy-to-extend.
Laragon is great for building and managing modern web applications. It is focused on performance - designed around stability, simplicity, flexibility and freedom.
Download and Install, the Laragon Full (64-bit) version. Run the installation, next>, next>, next>. You now have a fully working WAMP stack, plus Node/NPM, git, Composer and many more tools.
Once installed Add Laragon to Path: Menu > Tools > Path > Add Laragon to Path
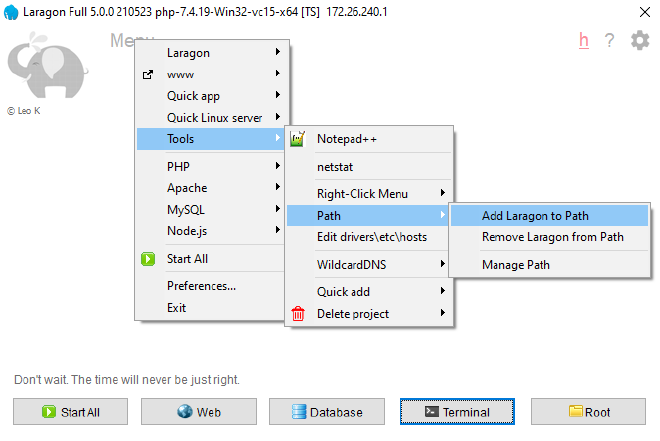
You then need to Sign out and back in for the path to be added to your user profile for all terminals and programs (CMD / PowerShell / Terminal / VS Code etc.)
Add Xdebug to PHP #
Xdebug can be downloaded from xdebug.org, there are currently 16 versions to choose!
PHP has 4 versions, from PHP 7.2 to PHP 8.0, each version can be 32-bit (x86) or 64-bit (x64), Thread Safe (TS) or Non Thread Safe (NTS). For Laragon v5 you would use 64 bit. Apache requires the Thread Safe (TS) version, Internet Information Services (IIS) requires the Non-Thread Safe version (NTS). The version of Xdebug needs to match the version of PHP. Look at the version installed to match the version required.
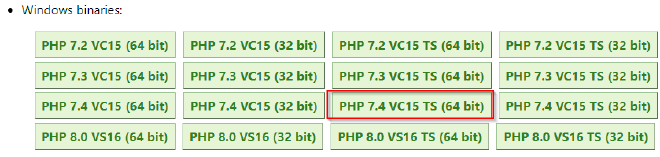
- Laragon ships with: php-7.4.19-Win32-vc15-x64 [TS] -> download PHP 7.4 VC15 TS 64 bit
- If you install: php-8.0.8-Win32-vs16-x64 [TS] -> download PHP 8.0 VS16 TS 64 bit
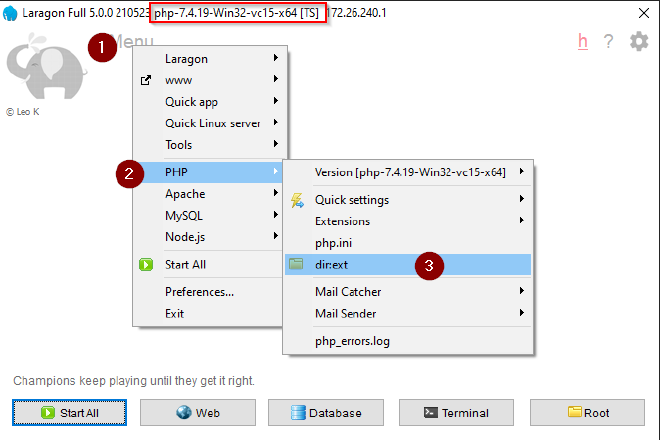
Once the correct dll is downloaded (e.g. ) copy it from your download folder to the php ext folder. Tip: Use Laragon to open this folder using: Menu > PHP > dir:ext
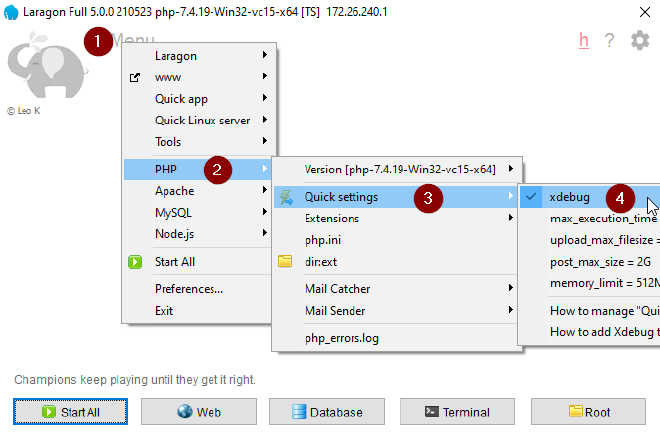
Back in Laragon enable the Xdebug extension:
Menu > PHP > Quick settings > ☑ xdebug
Next add Xdebug configuration to php.ini
Laragon Menu > PHP > php.ini
Wait for php.ini to open with Notepad++, scroll to the bottom of the file and add:
[xdebug]
xdebug.mode = coverage,debug,develop
Save and close the php.ini file.
This is the minimum required for debugging and code coverage, Xdebug default setting for xdebug.client_port is now ** 9003** and xdebug.client_host localhost, these no longer need to be specified in the php.ini.
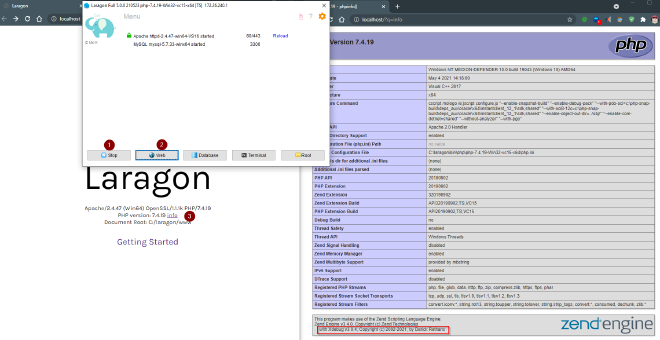
Check Xdebug using Laragon Web #
- Click the start button (it changes to Stop when running)
- Click Web
- Check the information on the Laragon webpage and next to the PHP version click info
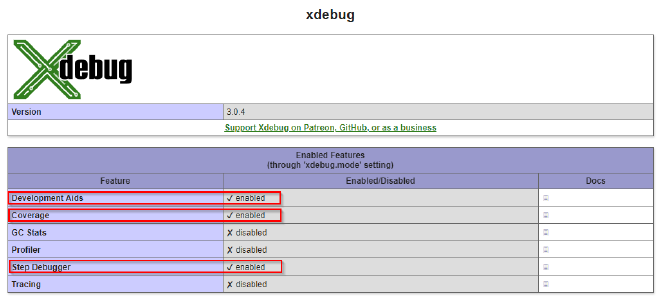
The phpinfo() page will display, check Xdebug is displayed
Scroll down and see the section on Xdebug, check coverage, debug and develop features are ticked.
Install VS Code #
Code editing. Redefined. Free. Built on open source. Runs everywhere.
The installer is straightforward, run, next, next finish.
Add Xdebug extension for VS Code #
Open VS Code and install the extension: Press F1, press Backspace to delete the > and
type ext install php-debug
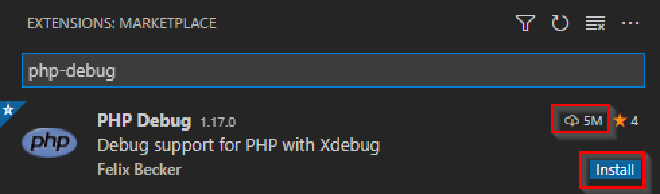
There are several extensions with the same name, install the one with 5M downloads.
Configure VS Code #
Next VS Code needs to have a launch script created, select Run from the menu and click Add Configuration…
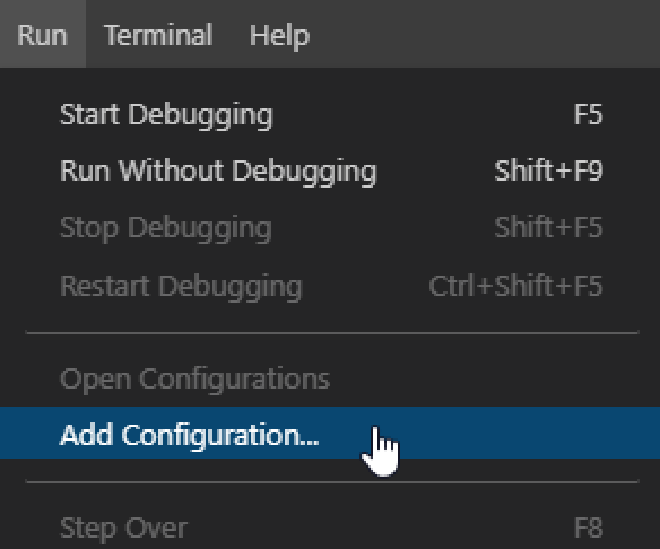
This will auto generate a launch.json file. If you are prompted for a language select PHP. The file can be closed.
Run test code from CLI #
Create a basic script to test the setup. Create a directory in the Laragon www directory, i.e. C:\laragon\www\ ** xdebug-test**, call the file example.php
<?php
$message = "<h1>Hello, world</h1>";
$xdebugBreak = xdebug_break();
echo $message;
?>
- Click the Run and Debug menu
- Change the drop-down options to Launch currently open script
- Click the Run icon
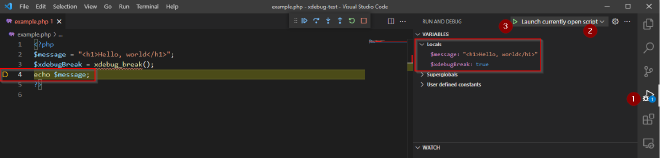
Notice although no debug point was created the script has triggered debugging after the xdebug_break() line. You can
also see the local variables.
The xdebug_break() function is useful when setting up Xdebug, if Xdebug isn’t loaded an exception will be thrown
instead! If you get this error re-check Xdebug has been enabled and the php.ini has xdebug.mode line as above.
It is also possible to set a different version of PHP to run from the command line. See troubleshooting below.
Fatal error: Uncaught Error: Call to undefined function xdebug_break() in
C:\laragon\www\xdebug-test\index.php:3 Stack trace: #0 {main} thrown in
C:\laragon\www\xdebug-test\example.php on line 3
Install Xdebug helper on Chrome #
For debugging on a web page a helper extension can be installed for Google Chrome browser (it is also available on other browsers).
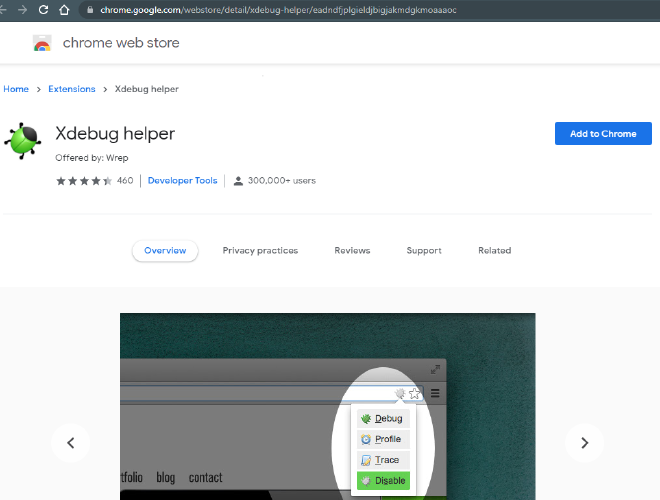
Click Add to Chrome (if you get a notification to add to Chrome click that too). Then find the grey xdebug helper icon in your list of icons (it maybe under the jigsaw icon), click it and select debug, I find it is useful to click the pin too, which will display the icon in the main icon it will turn green.
Debug code in a browser #
In VS Code:
- Click the Run and Debug menu
- Change the drop-down options to Listen for Xdebug
- Click the Run icon
The bar on the bottom of VS Code will display orange with the text Listen for Xdebug (xdebug-test)
Rename the file index.php
In Laragon:
- Click Menu
- Click www
- Select the xdebug-test folder
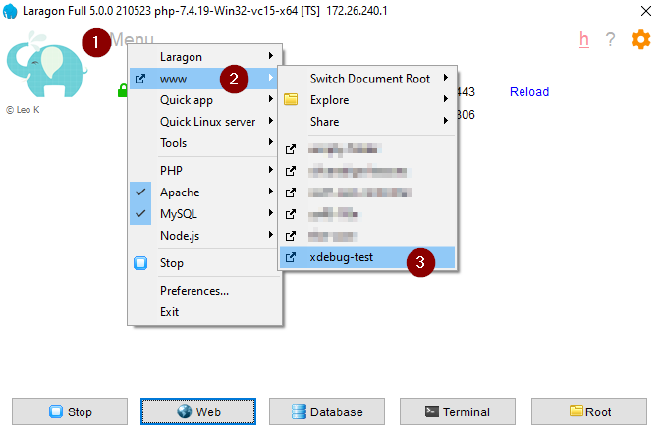
Your web browser will launch, switch to VS Code and you will see the debug session has stopped as before.
If it doesn’t automatically stop check the debug icon is green, if it is grey click it and select debug, then refresh the page.
The xdebug_break() function has now served its purpose, you can continue to use that function, however when the Xdebug
is disabled the code will throw an exception. Delete the line with the Xdebug function, press F9 to toggle a breakpoint,
a red dot will display to the right of the selected line.
If you are still debugging press F5 to continue. Refresh the webpage page and debugging will trigger at the breakpoint.
Refresh the webpage and the debugging will stop at the breakpoint.
Debug actions #
Once a debug session starts, the Debug toolbar will appear on the top of the editor.
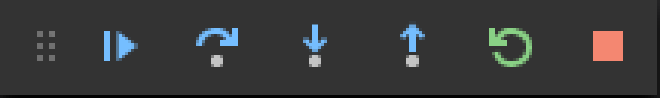
- Continue / Pause
F5 - Step Over
F10 - Step Into
F11 - Step Out
Shift+F11 - Restart
Ctrl+Shift+F5 - Stop
Shift+F5
For more information on how to use debug see the links in Further information, which link to official documentation and official YouTube video.
Troubleshooting #
Port 9003 is in use #
If there are any problems with port 9003 being used by another application run netstat
From Laragon:
- Menu
- Tools
- netstat
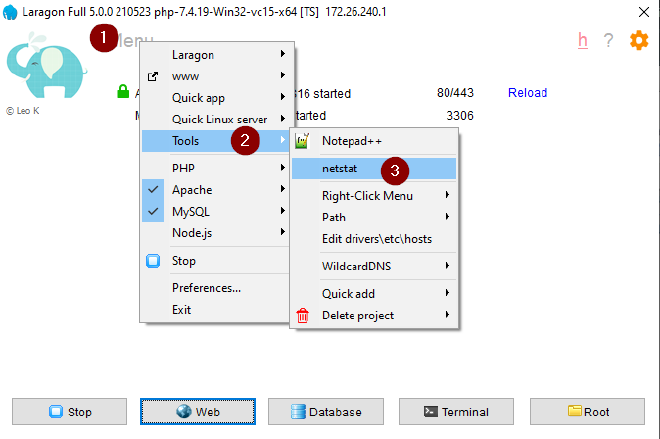
Wait a few seconds and Notepad++ will open with the stats.
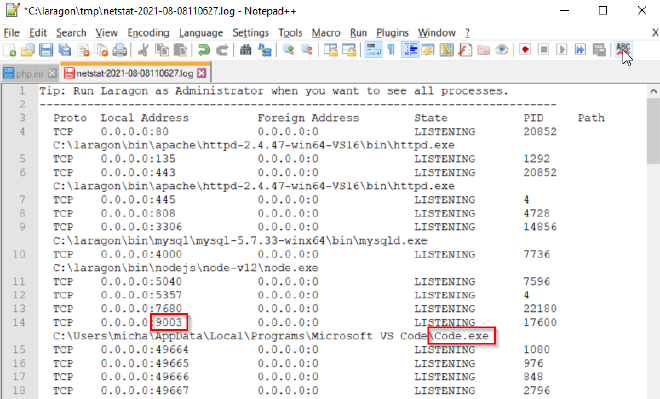
The important line is for port 9003, this is required for Xdebug to work, this example is correct, I have set VS Code to listen for Xdebug. If another program is using this port then change the port Xdebug uses and VS Code listens on:
- php.ini, e.g. add the line for Xdebug to use port 9004
[xdebug]
xdebug.mode = coverage,debug,develop
xdebug.client_port = 9004
- VS Code open launch.json (in the .vscode directory), change the two locations from “port”: 9003 to " port": 9004
{
  "version": "0.2.0",
  "configurations": [
    {
      "name": "Listen for Xdebug",
      "type": "php",
      "request": "launch",
      "port": 9004
    },
    {
      "name": "Launch currently open script",
      "type": "php",
      "request": "launch",
      "program": "${file}",
      "cwd": "${fileDirname}",
      "port": 0,
      "runtimeArgs": [
        "-dxdebug.start_with_request=yes"
      ],
      "env": {
        "XDEBUG_MODE": "debug,develop",
        "XDEBUG_CONFIG": "client_port=${port}"
      }
    },
    {
      "name": "Launch Built-in web server",
      "type": "php",
      "request": "launch",
      "runtimeArgs": [
        "-dxdebug.mode=debug",
        "-dxdebug.start_with_request=yes",
        "-S",
        "localhost:0"
      ],
      "program": "",
      "cwd": "${workspaceRoot}",
      "port": 9004,
      "serverReadyAction": {
        "pattern": "Development Server \\(http://localhost:([0-9]+)\\) started",
        "uriFormat": "http://localhost:%s",
        "action": "openExternally"
      }
    }
  ]
}
In Laragon, next to Apache click Reload. Click web button and info, as previously, scroll down to Xdebug and look for xdebug.client_port:
| Directive | Local Value |
|---|---|
| …. | …. |
| xdebug.client_port | 9004 |
| …. | …. |
Refresh the webpage created earlier and Xdebug will now work on port 9004.
Check the Xdebug helper icon is green, if it was grey click it and select Debug, wait for it to turn green and refresh the page once more.
PHP CLI is different from the PHP used by Apache #
Laragon makes is easy to switch versions of PHP, this can lead to the version used by Apache being different from the one used by VS Code or the command line.
php -v
PHP 7.4.19 (cli) (built: May  4 2021 14:24:38) ( ZTS Visual C++ 2017 x64 )
Copyright (c) The PHP Group
Zend Engine v3.4.0, Copyright (c) Zend Technologies
    with Xdebug v3.0.4, Copyright (c) 2002-2021, by Derick Rethans
The output for PHP is slightly different, the important lines are PHP 7.4.19 should be the same as used by Apache and with Xdebug v3…, if the PHP version is different see Add Laragon to all terminals below. If they are the same PHP version, but Xdebug doesn’t display check the php.ini and Xdebug is enabled, see Add Xdebug to PHP above.
Add Laragon to all terminals #
Just click Menu > Tools > PATH environment variable > Add Laragon to Path
You then need to Sign out and back in for the path to be added to your user profile for all terminals and programs (CMD / PowerShell / Terminal / VS Code etc.)
One point to note: if you change PHP version, you need to run Remove Laragon from Path, log off and back on. Then ** Add Laragon to Path** log off and back on to update the path set in user profile!
PHP and all the other Laragon applications will then be available in all terminals and applications, including VS Code.
Known problems #
Port 9003 conflicts with Nginx #
Laragon configures Nginx using laragon/etc/nginx/php_upstream.conf, which has the conflicting post 9003 with xDebug.
upstream php_upstream {
	server 127.0.0.1:9003 weight=1 max_fails=1 fail_timeout=1;
	server 127.0.0.1:9004 weight=1 max_fails=1 fail_timeout=1;
}
The workaround is to change the port used by xDebug in php.ini
[xdebug]
zend_extension = xdebug-3.2.0-8.2-vs16-nts-x86_64
xdebug.mode = coverage,debug,develop
debug.client_port = 9000
Xdebug changed the default port from 9000 to 9003 a few years ago. This will conflict with Nginx using the same port 9003, the work-around is to use the original post 9000.
netstat #
To check which posts are in run netstat:
- Laragon Start all
- Run Laragon menu > Tools > netstat
- Notepad++ will open with the results
- Look for port 9000 and 9003
Xdebug can not be automatically enabled #
When Xdebug is downloaded and copied to the ext directory, when switching to Lagaon and try to enable in Extensions or Quick settings, Laragon does not automatically add the Xdebug extension.
It is listed in the list of Extensions, when clicked the menu closes. If Apache is running it is restarted. However, the extension isn’t added to php.ini.
The workaround is to manually add the extension to php.ini:
[xdebug]
zend_extension = xdebug-3.2.0-8.2-vs16-nts-x86_64
xdebug.mode = coverage,debug,develop
Laragon will happily toggle the Xdebug extension on and off via Extensions or Quick settings.
Further information #
- Xdebug 3 — Documentation - full documentation for Xdebug 3
- YouTube Xdebug 3 Documentation - by Derick Rethans - A series of videos to explain how Xdebug 3 and all of its features work.
- Debugging in VS Code - official VS Code documentation.
- Laragon’s discussions - useful GitHub discussions for anything Laragon related, you may see some answers from me too 😃